Section 11.3 Viewing Plots
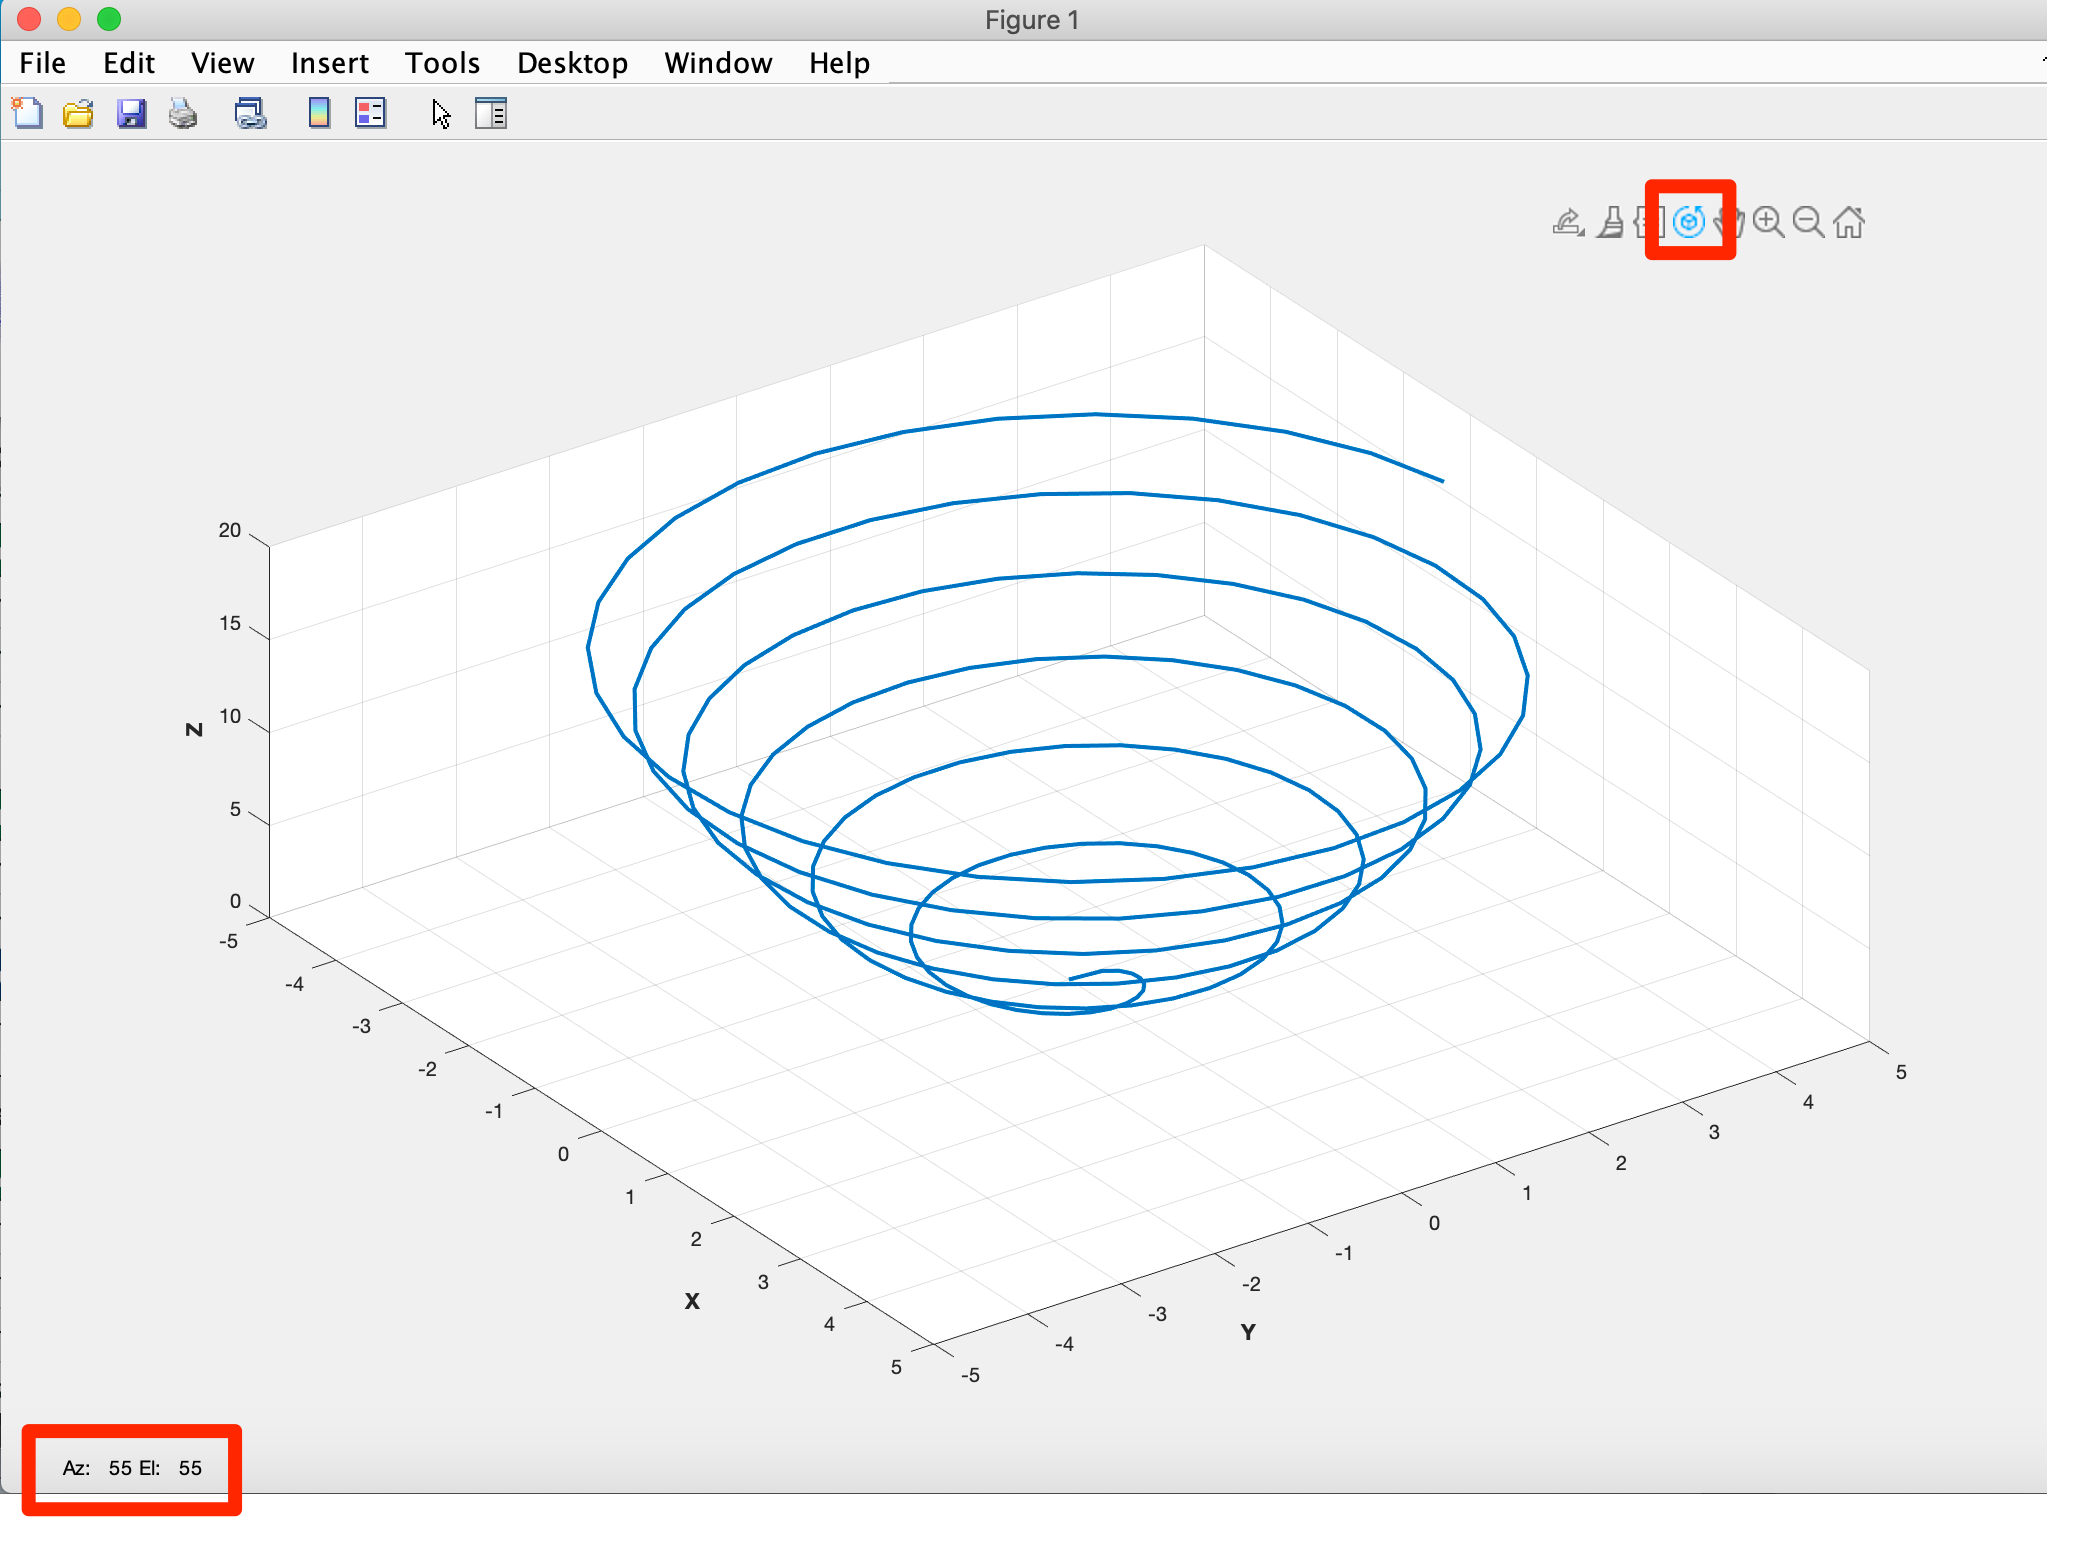
It is possible to change the viewing point of your plot (this is the point in space from which you are looking at the plot). One way to do so is to simply rotate the plot using the “Rotate 3D” functionality provided under “Tools” in the figure window. Once you find a good viewing angle you can take note of the viewer’s coordinates in order to be able to later on reproduce them using a typed command (namely the MATLAB view command).

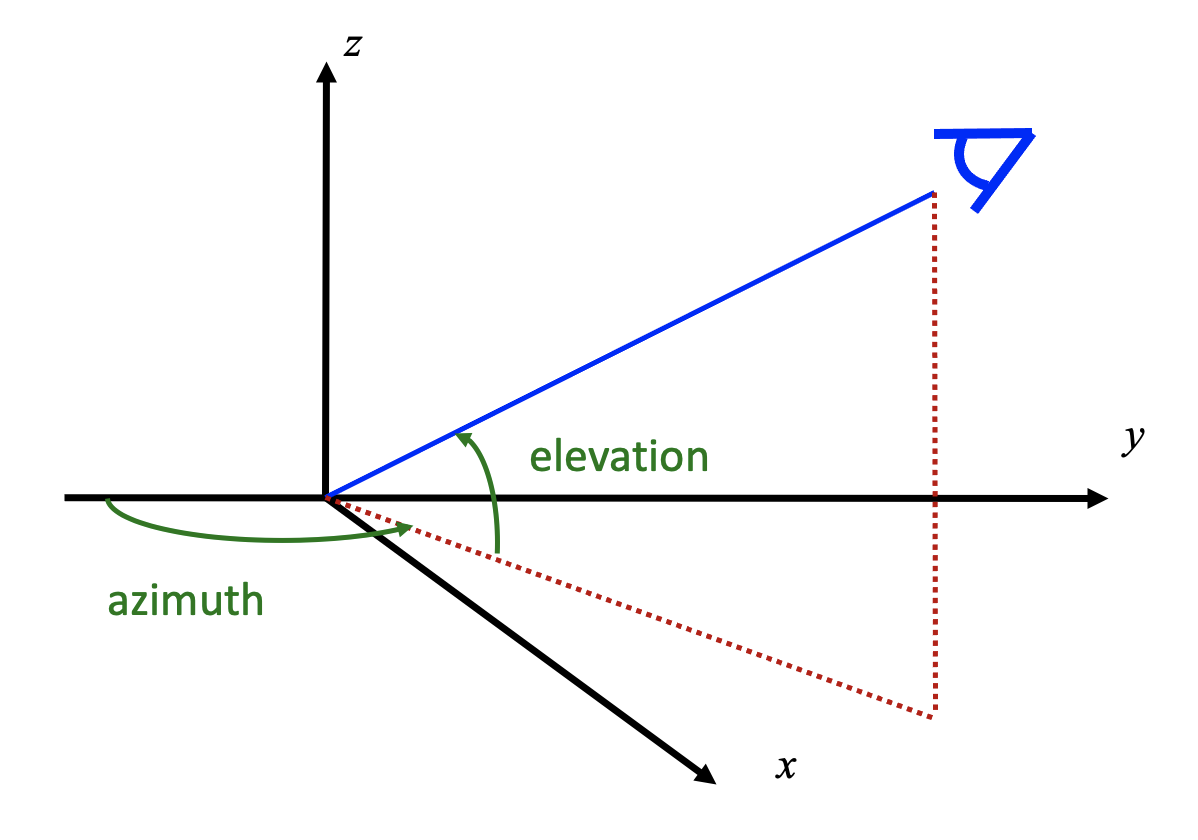
The viewing point is given in terms of “azimuth” and “elevation”. Here is how these are defined:
Azimuth az is the angle (in degrees) in the x-y plane, measured from the negative y-axis to the projection of the line from the origin to the viewpoint onto the x-y plane. A picture says more than a hundred words, so take a look at the below picture. Some more details:
-
az is measured relative to the negative y axis direction
-
az is defined as positive in the counterclockwise direction
Elevation el is the angle (in degrees) of elevation from the x-y plane. Again, look at the picture for details. Note that
-
positive value corresponds to opening an angle in the z-axis direction

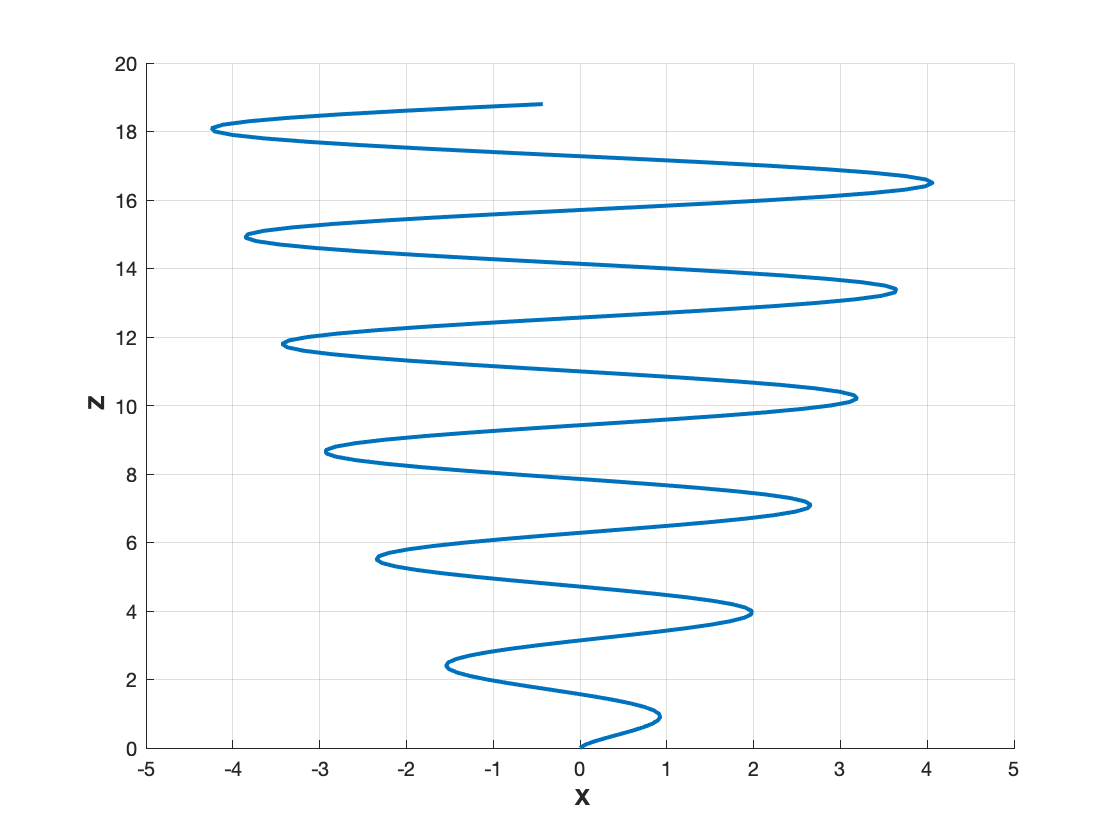
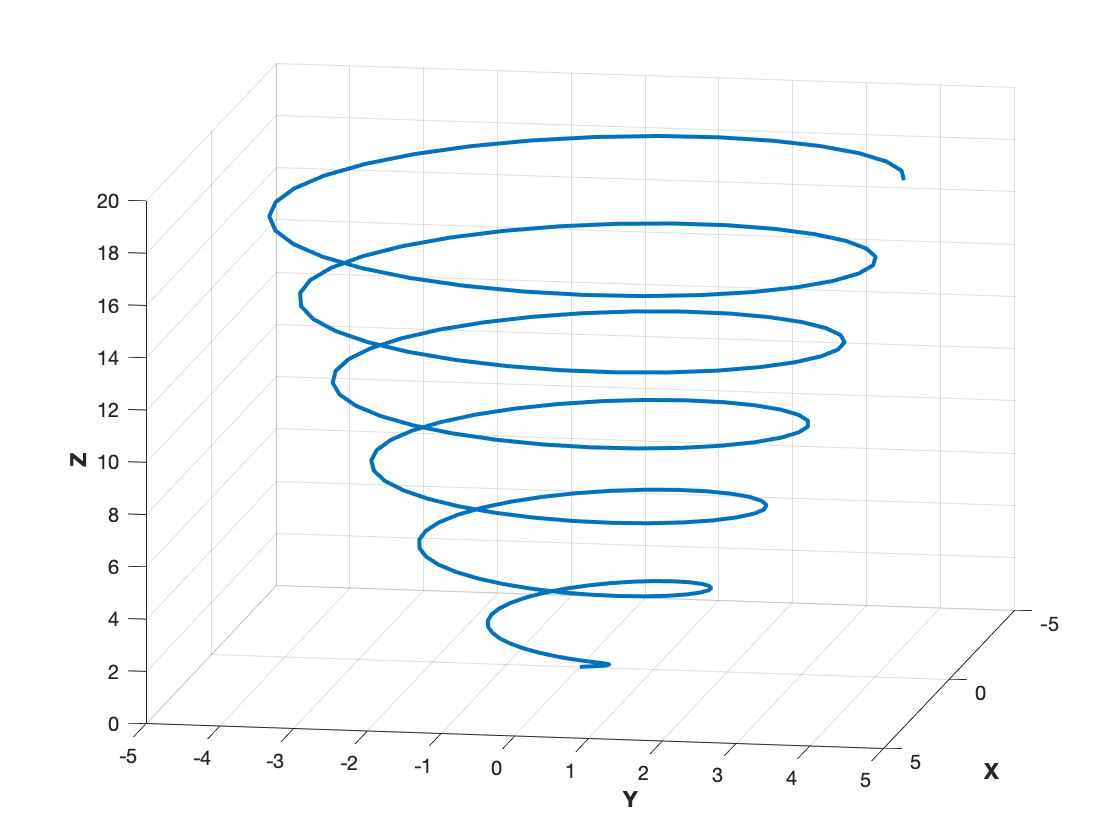
Here are some examples of different view points for the image of the spiral we created in the previous section:
view(0,0);
% or
view([0,0]);
view(100,15);


The default angles are az = -37.5° and el = 30°.

