Section 6.2 Creating Plots
The simplest plot is created using the
plot() command:
>> plot(x,y)
where
x and y are vectors of equal length. This creates a two-dimensional line plot of the data in y versus the corresponding values in x.
Each time the plot command is issued, the current plot is erased and the new plot is drawn.
All graphics are displayed in the Figure Window.
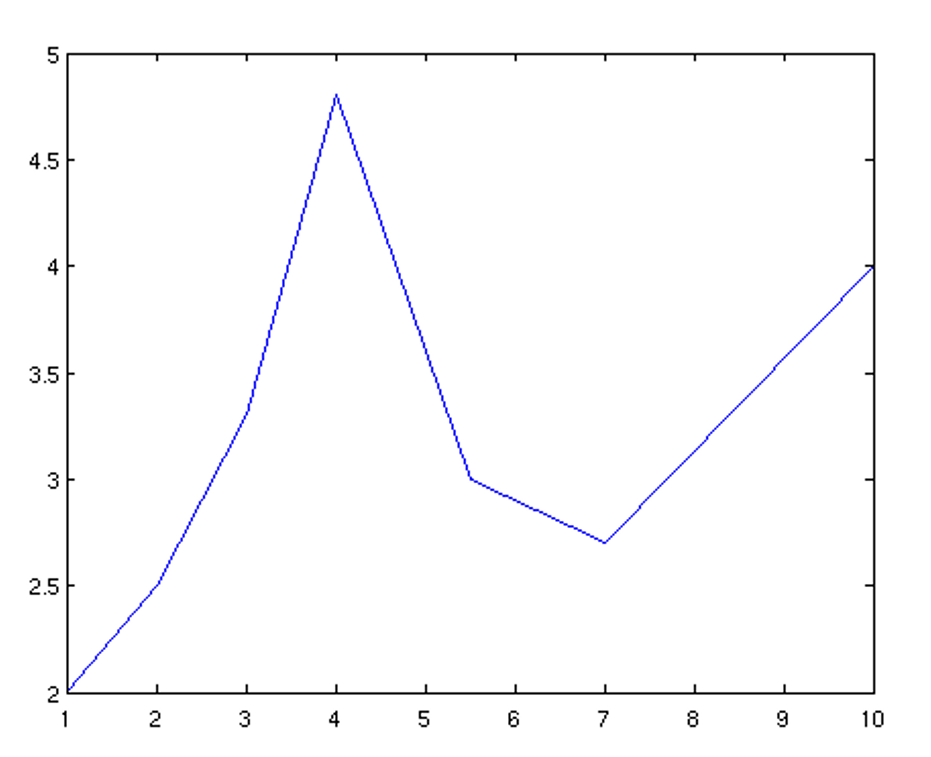
The default plot is a solid blue line of thickness 0.5 points which linearly interpolates the data (this means that lines are drawn between successive points in your data).
Many options are available to modify the look of a plot.
Here is an example of the default plot style:
>> x = [1 2 3 4 5.5 7 10];             % abscissa 1x7
>> y = [2 2.5 3.3 4.8 3.0 2.7 4.0];    % ordinate
>> plot(x,y)


