Section 6.3 Line Specifiers
There are numerous options to change the look of the plot.
>> plot(x,y,'line specifiers','PropertyName','PropertyValue')
'line specifiers' define the style and color of the line and type of markers for a plot:
| Line Style | Specifier | Line Color | Specifier | Marker Type | Specifier |
| solid (default) | - |
red | r |
plus sign | + |
| dashed | -- |
green | g |
circle | o |
| dotted | : |
blue | b |
asterisk | * |
| dash-dot | -. |
cyan | c |
point | . |
| magenta | m |
square | s |
||
| yellow | y |
diamond | d |
||
| black | k |
five-pointed star | p |
||
| white | w |
six-pointed star | h |
The line specifiers are typed as a single string and can appear in any order in the string. Here are some examples:
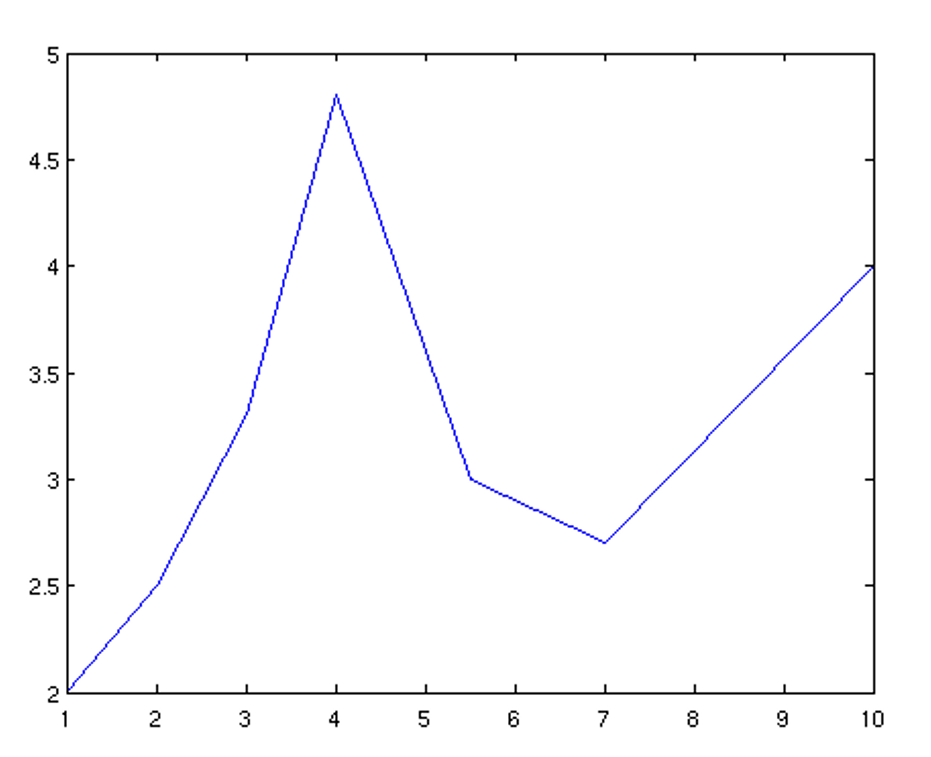
>> plot(x,y) % default blue solid line
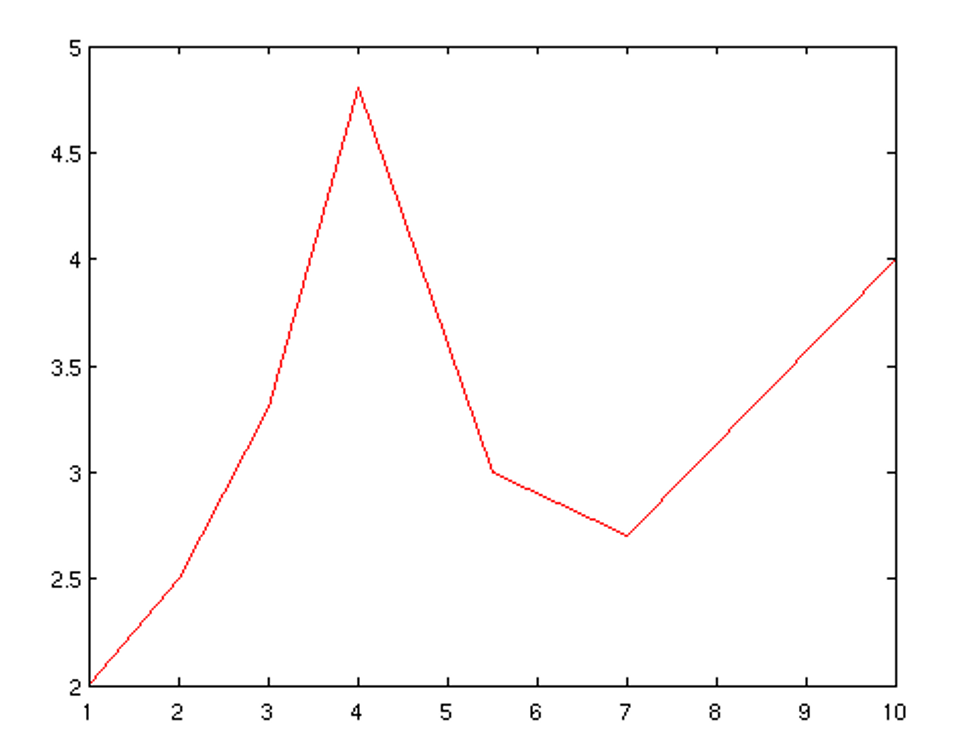
>> plot(x,y,'r') % red solid line
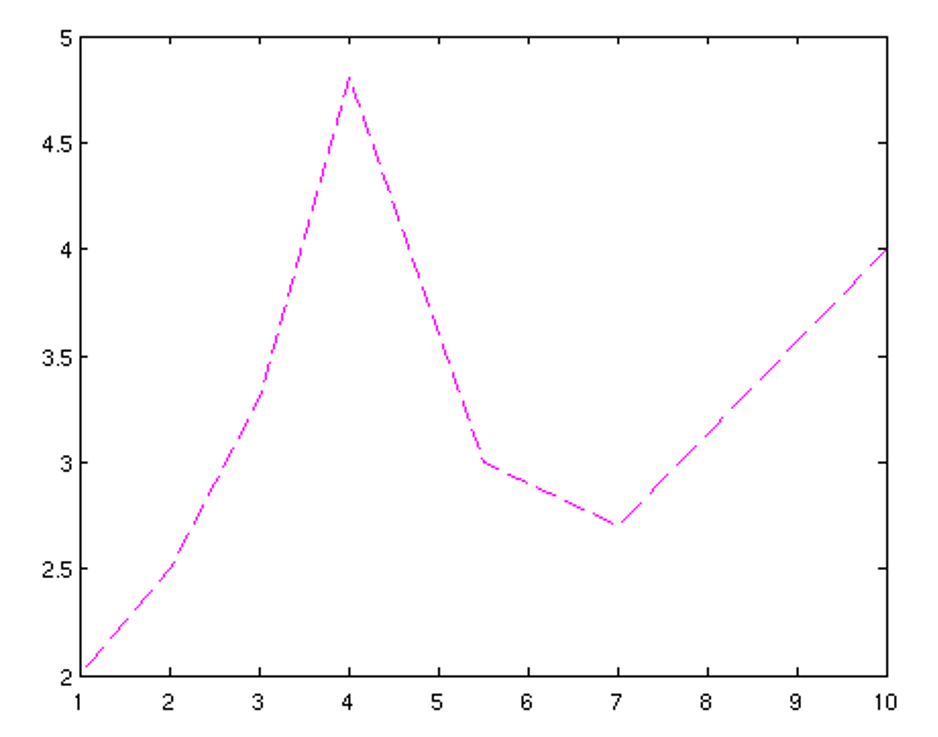
>> plot(x,y,'--m') % magenta dashed line
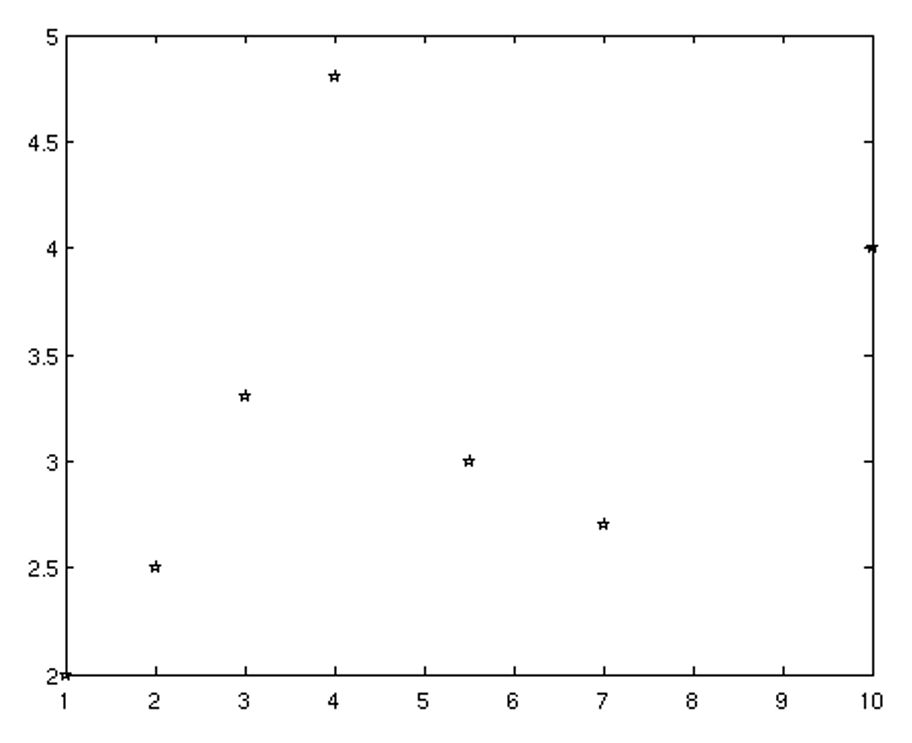
>> plot(x,y,'pk') % no line; black stars mark data
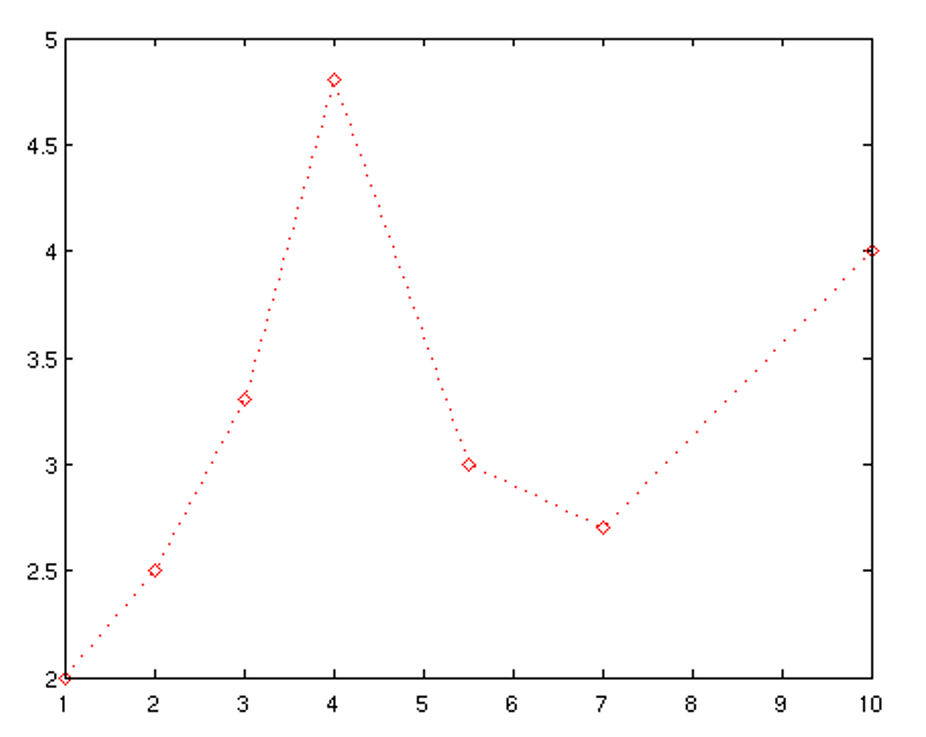
>> plot(x,y,'r:d') % red dotted line and diamonds
