Section 6.9 Creating Subplots
It is often desirable to group several plots together in a single figure. Saves paper!
Use the
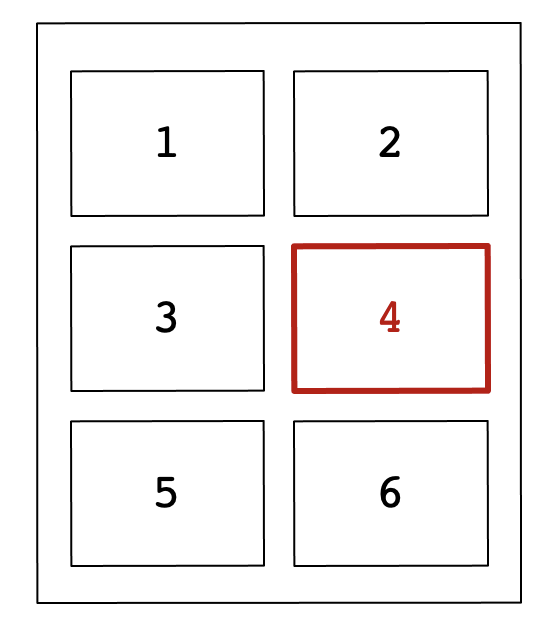
subplot() command to set up the Plotting Window into rectangular sub windows.
>> subplot(m,n,p)
This divides the region into an m x n array of rectangular plotting regions and makes the pth subplot active.
>> subplot(3,2,4)

Example: \(y = 2^{ -x/5 +10}\)
>> x = linspace(0.1,60,1000);
>> y = 2.^(-0.2*x+10);
>> subplot(2,2,1);
>> plot(x,y);
>> subplot(2,2,2);
>> semilogy(x,y);
>> subplot(2,2,3);
>> semilogx(x,y);
>> subplot(2,2,4);
>> loglog(x,y);

Subsection 6.9.1 Histograms
| Function | Effect |
hist(y) |
divide into 10 bins |
hist(y,nbins) |
divides into nbins bins |
hist(y,x) |
vector of bin center locations |
n = hist() |
vector with number in each bin |
[n,xout] = hist() |
vector with bin center locations |
>> scores = randn(1,200)*10 + 75;
>> subplot(2,2,1);
>> hist(scores)
>> subplot(2,2,2);
>> hist(scores,20)
>> subplot(2,2,3);
>> bins = 5:10:95;
>> hist(scores,bins)
>> subplot(2,2,4);
>> bins = 3:3:97;
>> hist(scores,bins)


