Section 6.1 Introduction to 2D Plots
The ability to make plots (figures) of your data (both two- and three-dimensional) is critical in modern scientific computing.
Plots are an extremely effective way to visualize information -- particularly in science and engineering.
MATLAB has very powerful and flexible built-in plotting capabilities which allow you to create a variety of two-dimensional plots including standard linear plots, logarithmic and semi-log plots, polar plots and histograms, as well as various three-dimensional surface and contour plots.
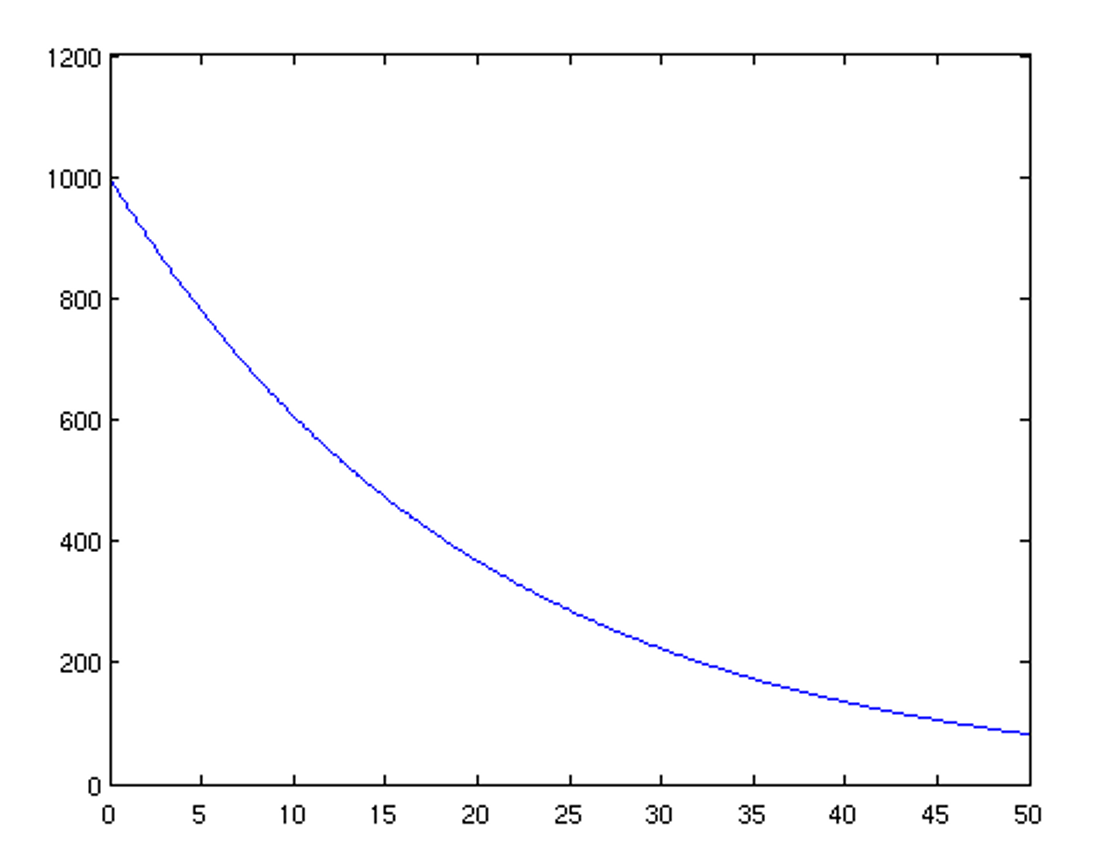
Here is an example of a very simple plot:

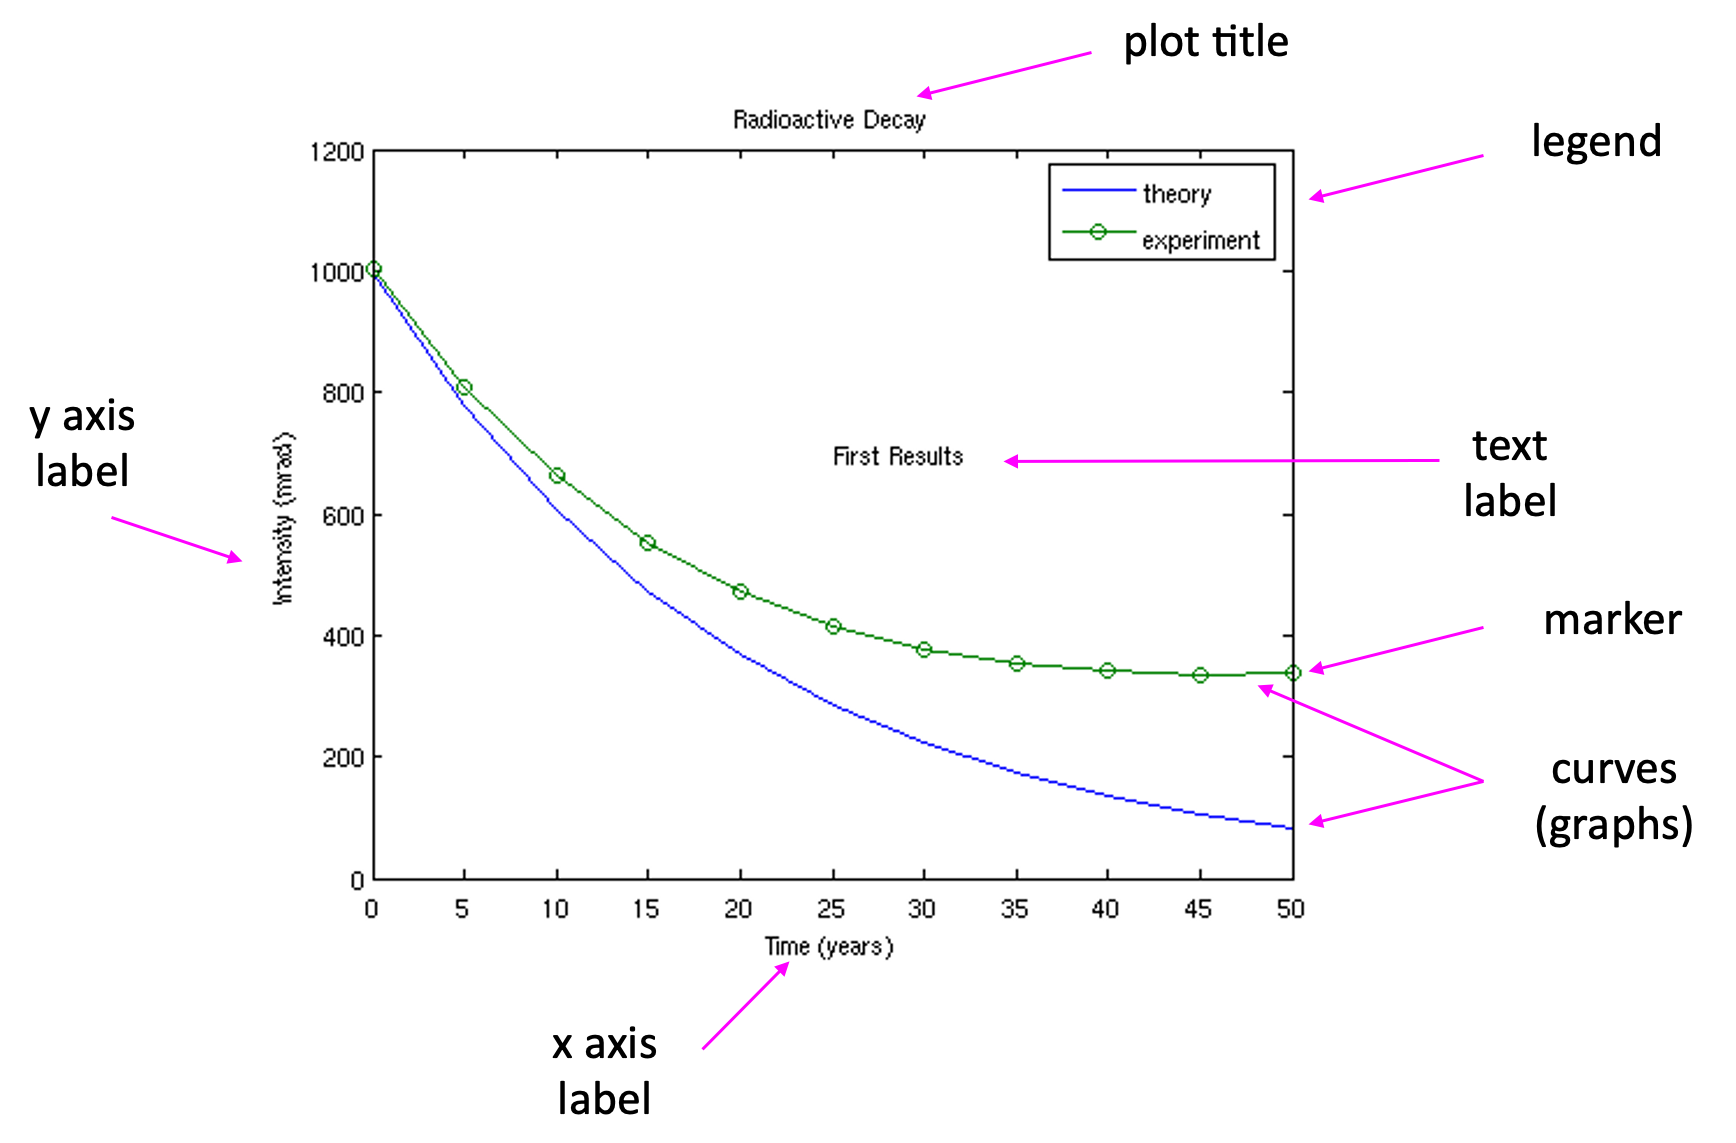
What is wrong with this plot? It needs labels and other information that will help the viewer interpret the plot correctly. Here is a better example:

We will learn how to create such labeled plots in this chapter.

